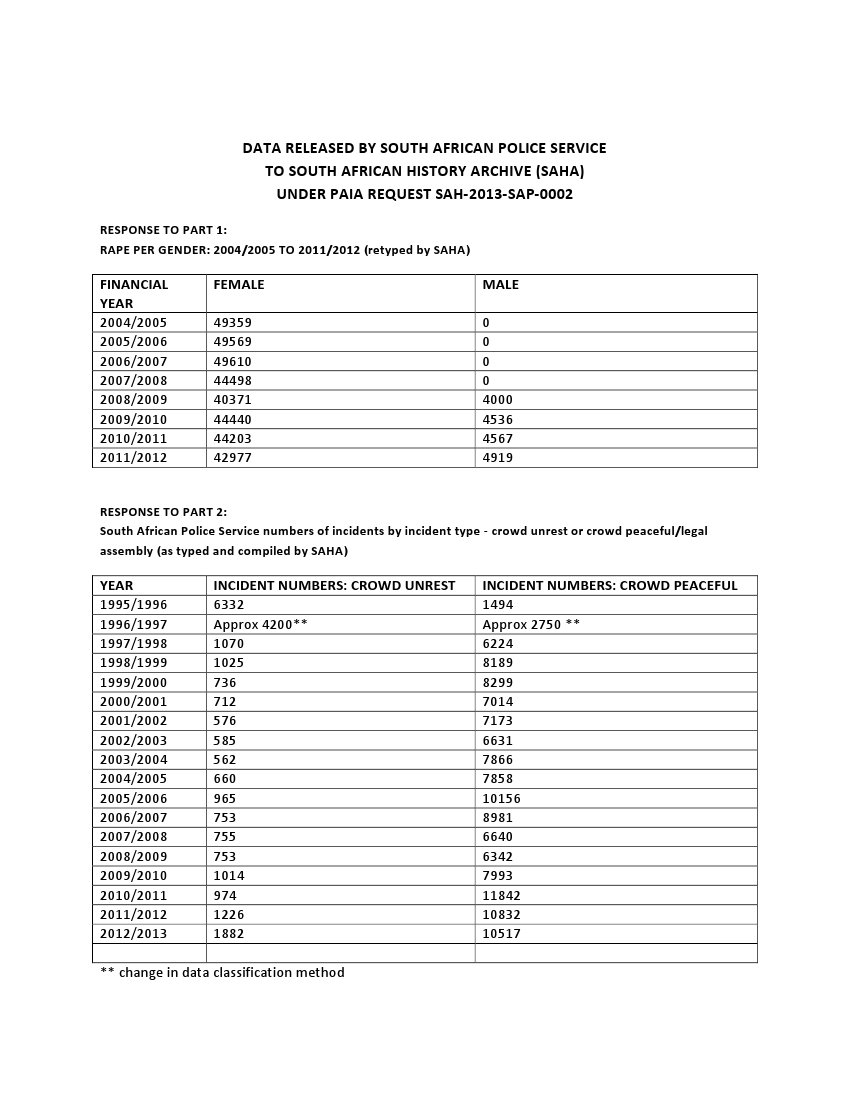
In response to a PAIA request submitted on 12 March 2013, SAHA has recently received a range of important, and somewhat intriguing, statistics from the South African Police Service (SAPS).
The PAIA request asked for:
• rape statistics broken down by gender (2004 - 2012), and
• data relating to public violence (2004 - 2012).
SAHA has obtained that information to encourage public review, analysis and debate around trends in sexual and public violence. The question that sits at the heart of this data is - what does it tell us about the new and emerging culture in South Africa? Does this data suggest we are on track to become the nation that so many apartheid-era activists struggled and died for?
In response to the first part of the request, the data released (set out below) shows no male rape at all prior to 2007/2008, when the police appear to have started to record that information. From that time, the South African Police Service records that almost 10% of all rape is perpetrated against males.
The South African Police Service's data also appears to show a slight overall reduction in rape between 2004/2005 to 2011/2012.
As data so often does, these statistics prompt as many questions as they provide answers. On a positive note, is this reduction in rape even more significant, if population has increased over the same period? On a more analytical note - has rape reduced overall, or has the reporting or investigation into rape claims reduced?
These questions might not be answered through a PAIA request, as the police may not have information that answers these questions. However, SAHA will follow up this PAIA request to learn what we can about whether the police have analysed their own data, and if so, what actions have been taken.
The South African Police Service has also provided 250 pages of documents responding to the second part of the request (see below). The documents set out the numbers of incidents for each province by month from 1 April 1995 to 31 March 1996 through to 2012/2013 by incident type of ‘crowd unrest' or ‘crowd peaceful/legal assembly'.
The data provided was compiled into a table by SAHA, and shows large numbers of crowd unrest in 1995/1996, until a change in classification resulted in that number reducing by a little over 80 per cent.
Since 2010/2011 the overall numbers of crowd activity has increased significantly. The numbers also show a spike in crowd numbers in 2005/2006.
Again, that data raises as many questions as it answers. Data analysts might ask if there has been a change in definition that has lead to changes in numbers? Or are there more demonstrations, strikes or rallies than in previous years? Social commentators and journalists, might ask what is the cause of these increases in crowd activity? And following the tragedy in Marikana, how are the police meeting these increases in number of crowd events in terms of resources and training?
While again, SAHA will submit a further PAIA request to obtain any existing analysis from the South African Police Service, SAHA also encourages others to analyse and debate this information, as part of the critical work of monitoring and evaluating the society that South Africa is becoming in this post-apartheid era.


